A pro-remigration group has launched a new interactive demographic map detailing the ethnic makeup of New Zealand, and showing that White people are already a minority in large swathes of the country.
The map, created by Remigration New Zealand and hosted on their website, allows users to choose between results from the 2013, 2018 and 2023 Censuses, for local statistical areas, territorial authorities, and regional councils.
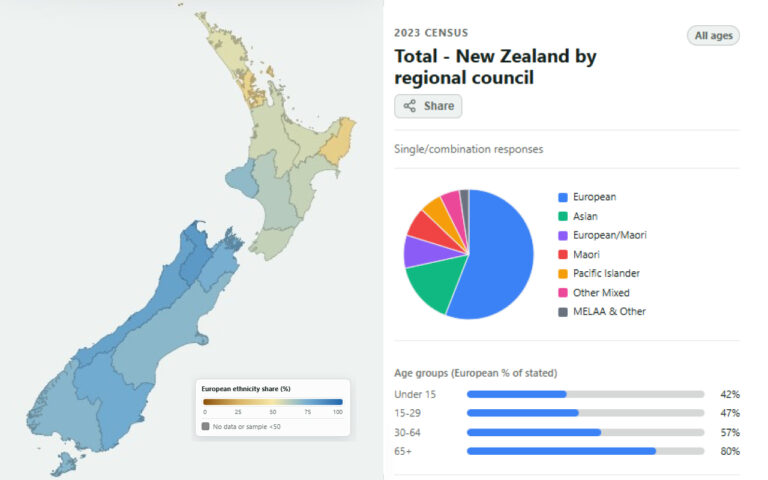
Each area includes detailed ethnicity statistics, a pie chart showing the major ethnicities, and a graph breaking down the European percentage of each area into four age brackets – under 15, 15 to 29, 30 to 64, and 65 or older.
“We now have an interactive demographic map available on our website showing the demographics of every area in New Zealand and how dire the situation has become,” the group said on social media.
The default setting is from the 2023 Census and shows that as of three years ago Europeans were just 55.9% of the population, followed by Asians on 15%, European/Maoris on 8.2%, Maoris on 7.3%, Pacific Islanders on 5.5%, other/mixed on 5%, and Middle Easterners, Latin Americans and Africans on 2.3%.
Europeans made up just 42% of under 15s, 47% of those aged 15-29, 57% of the 30 to 64 age group, and 80% of those 65 and above.
The map shows that 10 years earlier the percentages were European 64.9%, Asian 10.7%, Maori 6.9%, European/Maori 6.5%, Pacific Islander 5%, other/mixed 3.4%, and Middle East, Latin America and Africa 2.4%, while Europeans were a majority in every age bracket.
Auckland, the country’s largest city, was just 44.9% European at the time of the last Census, and in several local areas they made up less than 2% of the population. Only 29% of those aged under 15 were European.
The Gisborne Region had an even smaller percentage of Europeans with 37.6%, but Europeans were a small majority in all remaining North Island regions except for Taranaki, where they were 69.4% of the population.
The South Island remains supermajority White, with each region still more than 70% European, and every age bracket majority European.
Header image: The interactive map (Remigration New Zealand).